Ways to monitor performance in Ubuntu - Gnome System Monitor, Top, Htop
 + Add to Google News
- -
- ro
- en
- FlorinM
- 3 years ago
- 2020-08-31 08:00:00
- comments
- : 2 minute 30 secunde
- image: Gnome

From time to time it is recommended to check the parameters of the computer to see which applications / processes are not very efficient and consume excess resources, making the system difficult or causing unjustified increases in component temperature (processor, video card, etc.). In these situations it is necessary to make some adjustments such as closing the respective processes, possibly uninstalling some applications that repeatedly create problems and replacing them with more appropriate ones. And on Linux, the offer is very varied, both in terms of applications and monitoring methods.
Gnome System Monitor
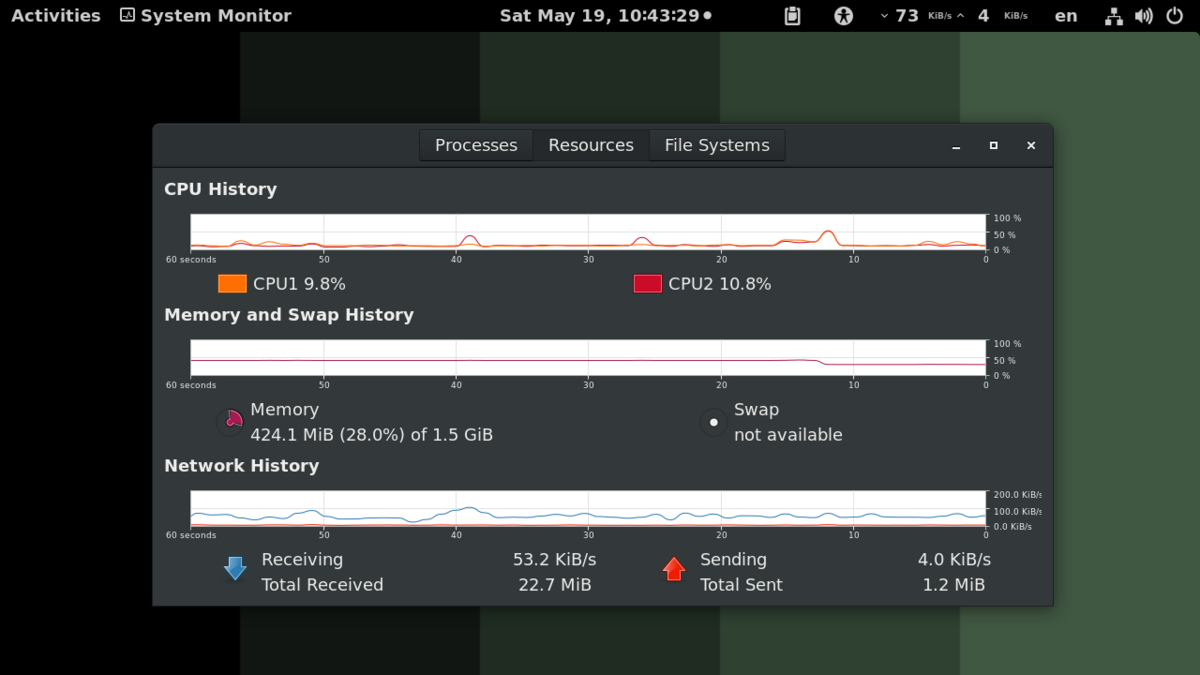
The best known and easiest to use monitoring tool on Ubuntu and its derivatives is "Gnome System Monitor". It has a friendly graphical interface and usually comes pre-installed on most distributions (Ubuntu, Linux Mint, Zorin OS, Voyager, etc.). We open the Dash (on Ubuntu) or the Menu (on the other distributions), write System Monitor, and if is installed, it will be found immediately. If it does not exist, open a Terminal and write the following command:
sudo apt-get install gnome-system-monitor
Apasam Enter, scriem parola, apasam din nou Enter si programul se va instal in foarte scurt timp. Acest instrument vine, dupa cum spuneam cu o interfata grafica usor de inteles, care dispune de trei tab-uri. În tabul din stânga sunt afisate procesele care ruleaza in acel moment, având posibilitatea de a le opri pe acelea care ingreuneaza fara rost sistemul. Se recomanda totusi o oarecare precautie când facem asta.
The middle tab shows us, in the form of graphs, the time consumption of the main resources - CPU, RAM / SWAP memory and the amounts of data uploaded / downloaded in / from the network / Internet. The tab on the right shows us information about the storage environment, more precisely the partition / partitions on which we have the respective operating system installed. We see here, from left to right, the name of the device, the mounting point, the type of file system (ext4, as a rule), the total capacity, the available space and the one used.
Top
For fans of the Terminal, there are two very quick options to check. The first is to type the " top" command in Terminal and press the Enter key. This command displays all currently running processes. To sort them by size, all you have to do is press the P key.
Htop
If you want a more complex version, you can try " htop". It is easy to install by typing the following command in the Terminal:
sudo apt-get install htop
Press Enter, type the password and then press Enter again. Then open the application by typing " htop" in Terminal.
Here we have many options, in addition to the fact that all information is displayed in the same window and visible, including the occupancy of the processor, RAM and SWAP. We can use the keys from F1 to F10 for what and how we want to see.
Lm-sensors
Finally, another aspect that is recommended to be followed is the temperature of the various components of the computer during operation. We can check this very easily if we install the "Lm-sensors" application. Type the following command in the Terminal, then Enter, type the password and enter Enter again for installation. Then we open it by typing the "sensors" command.
sudo apt-get install lm-sensors
...


- powered by Verysign